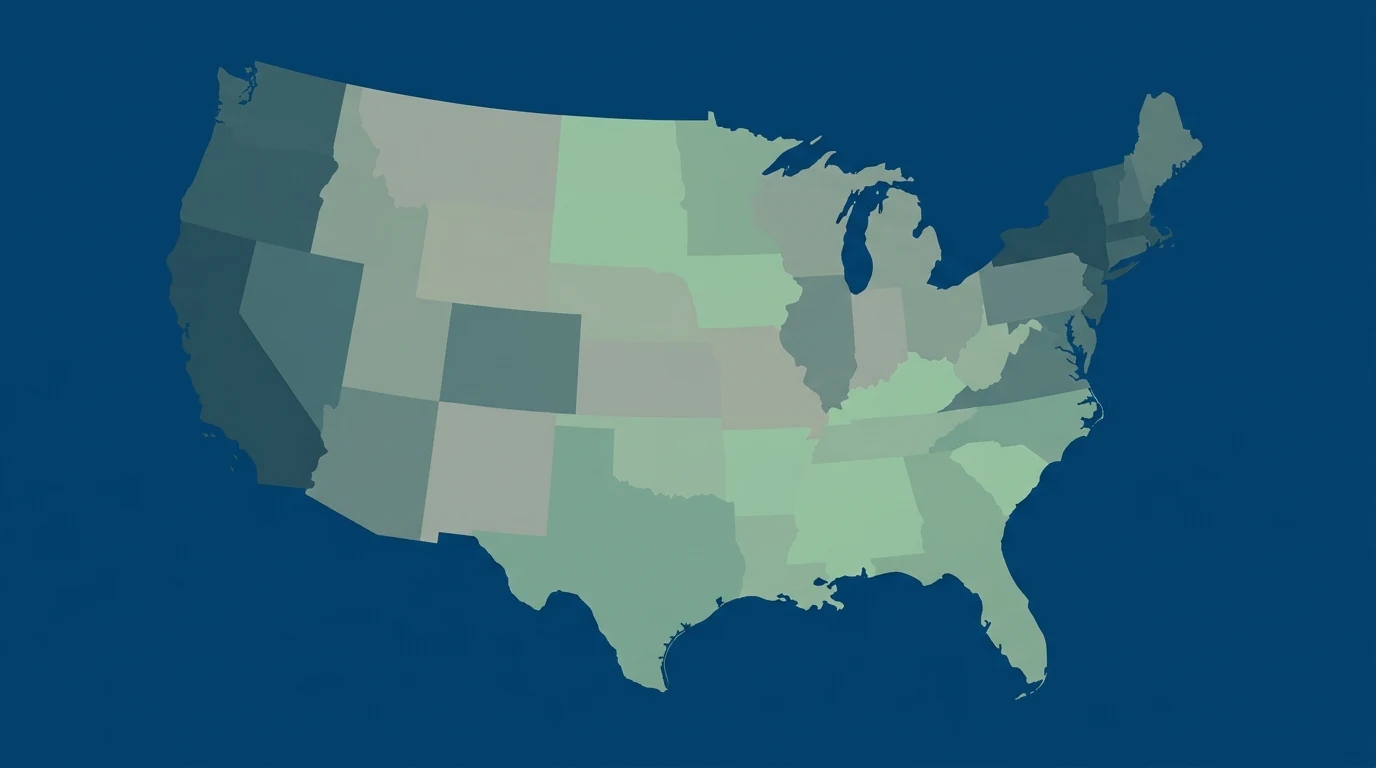
Vermont hospitals average $2,410 in Medicare payments for outpatient hernia repair. California hospitals average $6,954. That nearly 3× gap tells one story about hernia surgery costs by state — but for patients without comprehensive insurance, the more important number is something else entirely.
Nevada hospitals bill an average of $83,384 for hernia surgery. Florida hospitals bill $82,541. Both states sit well below California in Medicare payment rates — yet their hospitals have configured chargemaster pricing that creates a completely different cost exposure for uninsured patients. The state that looks "cheap" for Medicare recipients can be the most financially dangerous state for someone without coverage.
The analysis below uses CMS Medicare Provider Utilization and Payment Data for outpatient hernia surgery across 2,220 hospitals in all 50 states — the same facility-level dataset that powers the hernia surgery cost hub on this site. Every figure is verified against CMS outpatient APC payment codes (5361/5362) to ensure procedure-specific accuracy.
What the Numbers Mean: Medicare Payment vs. Billed Charges
The CMS dataset reports two separate figures for each hospital: what the hospital bills (the chargemaster rate) and what Medicare actually pays. These are not interchangeable.
Medicare payment is what CMS reimburses the hospital under the Outpatient Prospective Payment System (OPPS). It is adjusted by a hospital wage index that accounts for local labor costs — which is the primary reason Southern states with lower wage indexes pay less in Medicare rates than high-wage states like California and Massachusetts. Medicare patients owe approximately 20% of the Medicare-approved amount as coinsurance under Part B, plus any applicable deductible.
Billed charges are the chargemaster sticker price — what the hospital submits to any payer before negotiation. Insurance companies and managed care networks negotiate steep discounts off this rate. Uninsured and self-pay patients face the billed rate as a starting point, though hospitals are required under IRS 501(r) rules to limit charges to patients who qualify for financial assistance. As explained in our piece on how hospital chargemasters work, the billed rate is the ceiling, not the actual cost — but it establishes the negotiation floor and determines the starting balance before discounts are applied.
Hernia Surgery Cost by State: Full CMS Data Table
The table below shows outpatient hernia surgery costs across all 50 states, sorted from lowest to highest Medicare payment. "Medicare Avg" is the mean payment Medicare makes to hospitals in that state. "Billed Avg" is the mean chargemaster rate hospitals submit. "Markup" is the ratio of billed-to-paid. All figures are averages across facilities with 11 or more qualifying cases, per CMS data release standards.
| State | Medicare Avg | Billed Avg | Markup Ratio | Hospitals |
|---|---|---|---|---|
| VT | $2,410 | $21,457 | 8.9× | 6 |
| MS | $4,427 | $34,501 | 7.8× | 35 |
| AL | $4,504 | $50,519 | 11.2× | 41 |
| TN | $4,520 | $39,390 | 8.7× | 57 |
| LA | $4,598 | $42,063 | 9.1× | 48 |
| OK | $4,604 | $42,956 | 9.3× | 41 |
| OH | $4,687 | $41,511 | 8.9× | 98 |
| WV | $4,693 | $37,100 | 7.9× | 19 |
| KY | $4,731 | $37,235 | 7.9× | 43 |
| AR | $4,814 | $30,659 | 6.4× | 29 |
| KS | $4,825 | $35,078 | 7.3× | 35 |
| FL | $4,893 | $82,541 | 16.9× | 142 |
| MO | $4,897 | $39,175 | 8.0× | 56 |
| GA | $4,902 | $47,904 | 9.8× | 69 |
| SC | $4,918 | $52,154 | 10.6× | 43 |
| NC | $4,929 | $38,122 | 7.7× | 65 |
| IA | $4,941 | $32,913 | 6.7× | 26 |
| NM | $4,960 | $50,756 | 10.2× | 18 |
| MI | $5,024 | $33,294 | 6.6× | 74 |
| ME | $5,045 | $27,697 | 5.5× | 13 |
| TX | $5,072 | $58,078 | 11.5× | 181 |
| NE | $5,095 | $32,511 | 6.4× | 19 |
| IN | $5,116 | $49,934 | 9.8× | 57 |
| VA | $5,176 | $48,370 | 9.3× | 61 |
| IL | $5,179 | $44,656 | 8.6× | 91 |
| UT | $5,186 | $31,146 | 6.0× | 26 |
| PA | $5,219 | $45,496 | 8.7× | 106 |
| WI | $5,220 | $35,500 | 6.8× | 56 |
| WY | $5,288 | $30,369 | 5.7× | 8 |
| ID | $5,338 | $35,123 | 6.6× | 15 |
| MN | $5,349 | $28,095 | 5.3× | 43 |
| SD | $5,469 | $28,543 | 5.2× | 14 |
| CO | $5,548 | $56,545 | 10.2× | 41 |
| AZ | $5,621 | $63,064 | 11.2× | 45 |
| NY | $5,692 | $31,264 | 5.5× | 96 |
| MT | $5,708 | $31,541 | 5.5× | 11 |
| RI | $5,742 | $20,276 | 3.5× | 9 |
| NH | $5,758 | $46,532 | 8.1× | 12 |
| ND | $5,777 | $26,857 | 4.6× | 6 |
| DE | $5,858 | $35,611 | 6.1× | 6 |
| OR | $5,927 | $36,989 | 6.2× | 29 |
| WA | $5,952 | $53,020 | 8.9× | 40 |
| NV | $5,997 | $83,384 | 13.9× | 17 |
| NJ | $6,069 | $46,866 | 7.7× | 49 |
| DC | $6,102 | $55,825 | 9.1× | 4 |
| AK | $6,143 | $46,404 | 7.6× | 6 |
| HI | $6,146 | $29,978 | 4.9× | 11 |
| CT | $6,337 | $34,096 | 5.4× | 23 |
| MA | $6,449 | $23,415 | 3.6× | 48 |
| CA | $6,954 | $71,440 | 10.3× | 176 |
Source: CMS Medicare Outpatient Provider Utilization and Payment Data, outpatient APC codes 5361/5362 (hernia repair, Level 1 and Level 2 Musculoskeletal). Hospitals with fewer than 11 qualifying cases are excluded per CMS disclosure rules. National averages: $5,303 Medicare payment, $47,624 billed charges, 9.0× markup ratio.
Why the South Leads for Medicare Patients
Seven of the ten states with the lowest Medicare payment averages are in the South or Appalachian region: Mississippi, Alabama, Tennessee, Louisiana, Oklahoma, West Virginia, and Kentucky. The primary driver is the CMS hospital wage index, which adjusts the labor-related portion of OPPS payment rates (roughly 60% of the base payment) according to local hospital wages. Southern states have lower healthcare wage structures, so Medicare pays lower rates to local hospitals — which benefits Medicare patients but has no direct effect on uninsured patients facing chargemaster rates.
Vermont's position at the very bottom of the Medicare payment table ($2,410) reflects a combination of low local wages and the fact that Vermont has only six hospitals in the CMS dataset for this procedure, making the state average more sensitive to a few facilities with lower payment profiles. It should not be interpreted as evidence that Vermont has solved hospital pricing for non-Medicare patients — the $21,457 average billed rate is notable but not the lowest in the country.
For a knee replacement, a similar Southern advantage exists in CMS payment data. The wage index effect compresses Medicare rates across nearly all surgical procedures in lower-wage labor markets — not just hernia repair.
The Florida and Nevada Paradox
Florida and Nevada represent the most dramatic gap between Medicare rates and billed charges in the hernia dataset. Florida's average Medicare payment ($4,893) ranks it among the cheaper states for Medicare patients — similar to Tennessee, Louisiana, and Ohio. But Florida's average billed charge is $82,541, producing a 16.9× markup ratio that is the highest of any state in the table. A Medicare patient in Florida pays a fraction of that; an uninsured patient starts negotiations from it.
Nevada shows a similar pattern with $83,384 average billed charges and only $5,997 average Medicare payment — a 13.9× markup. The concentration of large for-profit hospital systems in both states, combined with limited hospital competition in many Florida markets and Nevada's Las Vegas-dominant geography, allows chargemaster rates to escalate well beyond what wage-index economics alone would predict.
As discussed in our analysis of Medicare payment versus hospital billed charges, the gap between these two numbers represents the negotiation surface for both commercial insurers and uninsured patients. States where that gap is widest are simultaneously favorable for Medicare patients (who pay a government-negotiated share) and potentially most dangerous for those without coverage.
Massachusetts and Rhode Island: The Inverse
Massachusetts is the most expensive state for Medicare patients ($6,449 average payment), driven by Boston-area wage index values among the highest in the country. But Massachusetts's average billed charges ($23,415) are the second lowest in the nation — a 3.6× markup, compared to a national average of 9.0×.
Rhode Island shows a similar pattern: $5,742 average Medicare payment (above the national average of $5,303) paired with $20,276 average billed charges — the lowest billed average in the country — and a 3.5× markup. Both states have a high concentration of academic medical centers and nonprofit hospital systems operating in a relatively compressed chargemaster pricing environment despite high labor costs.
The practical implication: an uninsured patient in Massachusetts or Rhode Island starts negotiations from a billed rate that is roughly one-quarter of what an uninsured patient in Nevada or Florida faces. High Medicare rates in these states reflect labor market economics; restrained billed charges reflect a different aspect of hospital market behavior entirely.
Hernia Surgery and the National Scale
Over 1 million hernia repairs are performed annually in the United States, making it one of the most common elective surgical procedures. The majority are performed in outpatient settings — ambulatory surgery centers and hospital outpatient departments — which is why this analysis uses outpatient APC data rather than inpatient DRG codes. The CMS dataset covers 2,220 facilities reporting outpatient hernia repair with sufficient volume to meet CMS disclosure thresholds.
The national average Medicare payment of $5,303 per procedure represents what CMS reimburses the facility. Patient out-of-pocket exposure under standard Medicare Part B is approximately 20% of the Medicare-approved amount after the annual deductible. For a patient without supplemental (Medigap) coverage, that equates to roughly $1,060 in cost-sharing on a $5,303 facility payment — not counting separate surgeon fees billed under Part B, which average $500–$800 for hernia repair.
The full interactive hospital price map — searchable by state, sortable by cost, with individual hospital records — is available on the hernia surgery cost page. The state averages in this table are a useful compass, but the hospital-level data shows why the most meaningful comparison is between specific facilities, not state averages. A patient in California can find hospitals at half the state average; a patient in Florida can find hospitals at a fraction of that state's extreme billed-charge average.
See Hernia Surgery Costs at Hospitals Near You
Browse the interactive price map with individual hospital Medicare payments, billed charges, and service counts across all 50 states.
View Hernia Surgery Costs →What This Means for Planning Hernia Surgery
The state-level averages above provide useful orientation, but the decision that moves the needle is choosing between specific hospitals and surgical settings — not choosing a state. Within California (the most expensive average state), the range between the lowest- and highest-cost qualifying hospitals spans several times the state average. Similar within-state variation exists in Florida, Texas, and Ohio.
For patients using insurance: confirm whether your network includes hospitals in different cost tiers. Hospital systems within the same metro area can have dramatically different negotiated rates, which same-city hospital price gaps document in detail across common procedures. The state table shows the terrain; the hospital map shows the specific choices available within it.
For patients without insurance or with high-deductible plans: the billed charge column is the starting point, not the ending price. Hospitals are required to post their standard charges under the CMS Hospital Price Transparency Rule. Uninsured patients who qualify for financial assistance programs — and many hospitals' eligibility thresholds extend to 300–400% of the federal poverty level — may face rates significantly lower than the chargemaster figures shown here.
For cosmetic procedures, this data does not apply: hernia repair and other Medicare-covered procedures appear in CMS data precisely because Medicare pays for them. Cosmetic surgeries like a facelift are not covered by Medicare and do not appear in this dataset. Their cost variation follows a different pattern governed by surgeon fees and facility pricing rather than the wage-index-adjusted payment structure that shapes Medicare rates.